Insights

See the numbers.Then watch the visits.

Analytics, session replay, and heatmaps are built into every BrightSite site. There is no script to paste in and no separate tool to log in to.

AnalyticsLast 30 days
3On site now
572People
1,284Sessions
2,602Views
03:40Avg time
47.4%Bounce rate

ViewsPeople
  1. 01

    A spike on the chart.

    Sunday the 21st doubled a normal day. Where did those visits come from, and what did people do?

  2. 02

    Pick a visit from that day.

    Spotlight lists every recorded session with its pages, place, device, and length.

  3. 03

    Watch what they did.

    Replay the visit: where they scrolled, what they clicked, and how long each page held them.

Heatmaps

Where people click, and where they stop.

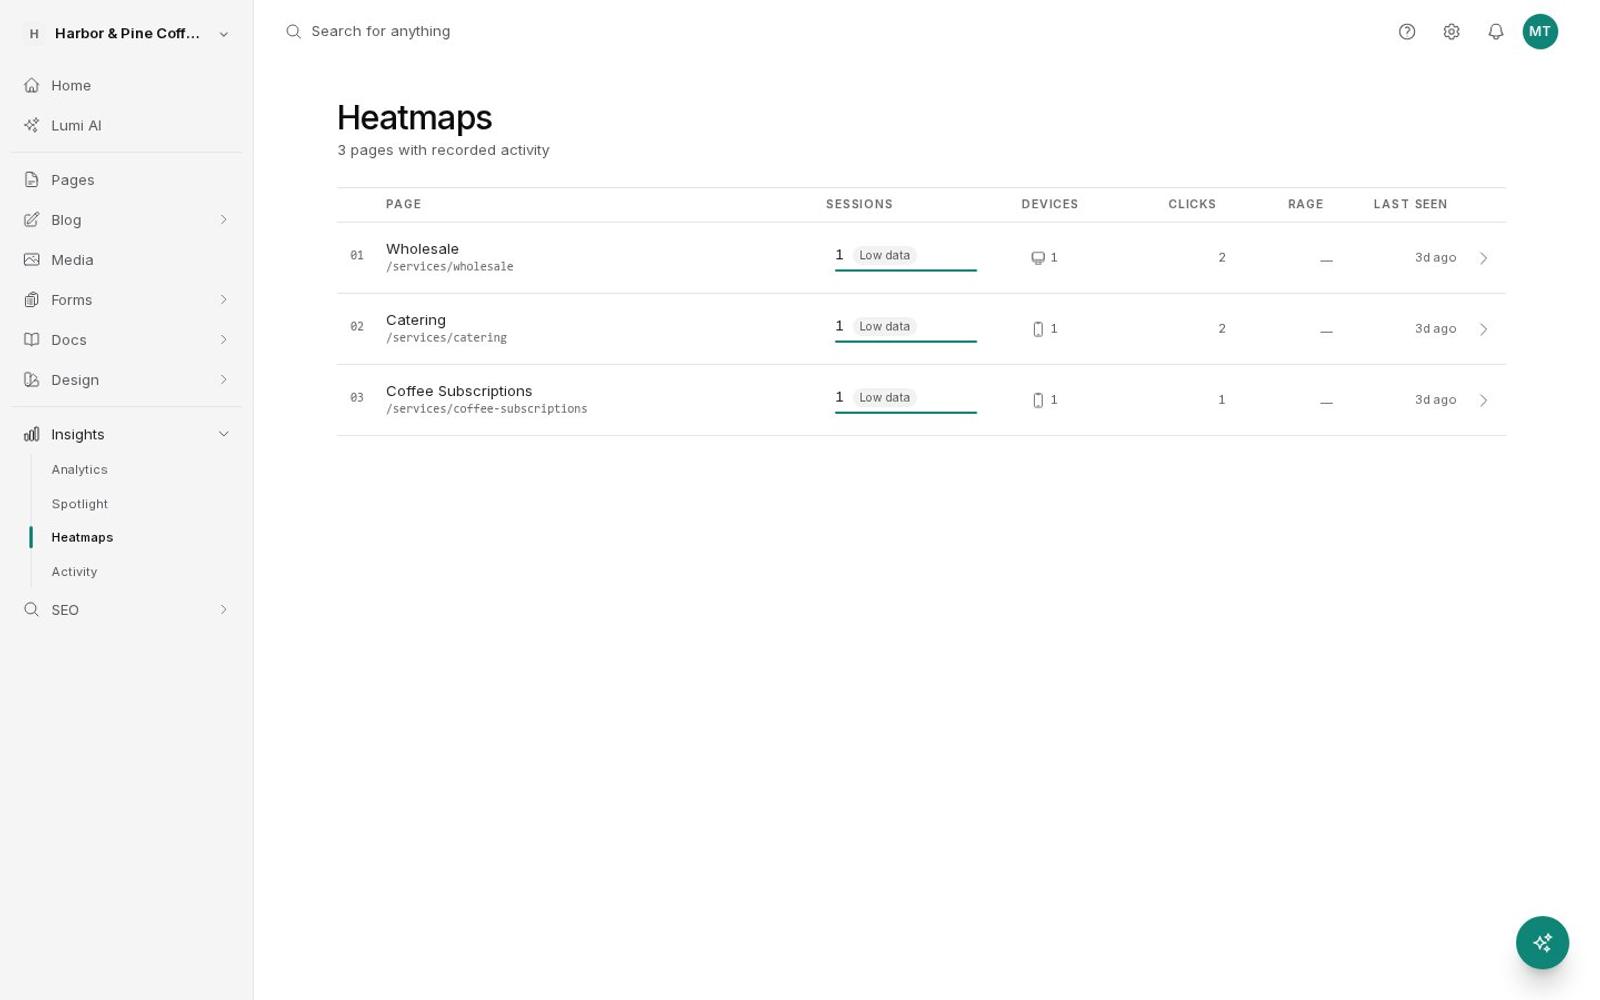
Every page gets click, scroll-depth, and engagement maps, filtered by device, with rage clicks counted. When you change the page, the maps start fresh for the new version.

ClicksScroll depthEngagement
By hand or by asking

Read it yourself, or ask for the answer.

Open the reports and dig in, or ask Lumi, Claude, or ChatGPT a plain question about your site.

Get the month in a paragraph

Open Analytics, pick a date range, and read people, sessions, views, time on site, bounce rate, top pages, and sources. Press Summarize this period for a short write-up.

Ask how the site is doing. You get the numbers that moved and a next step to take.
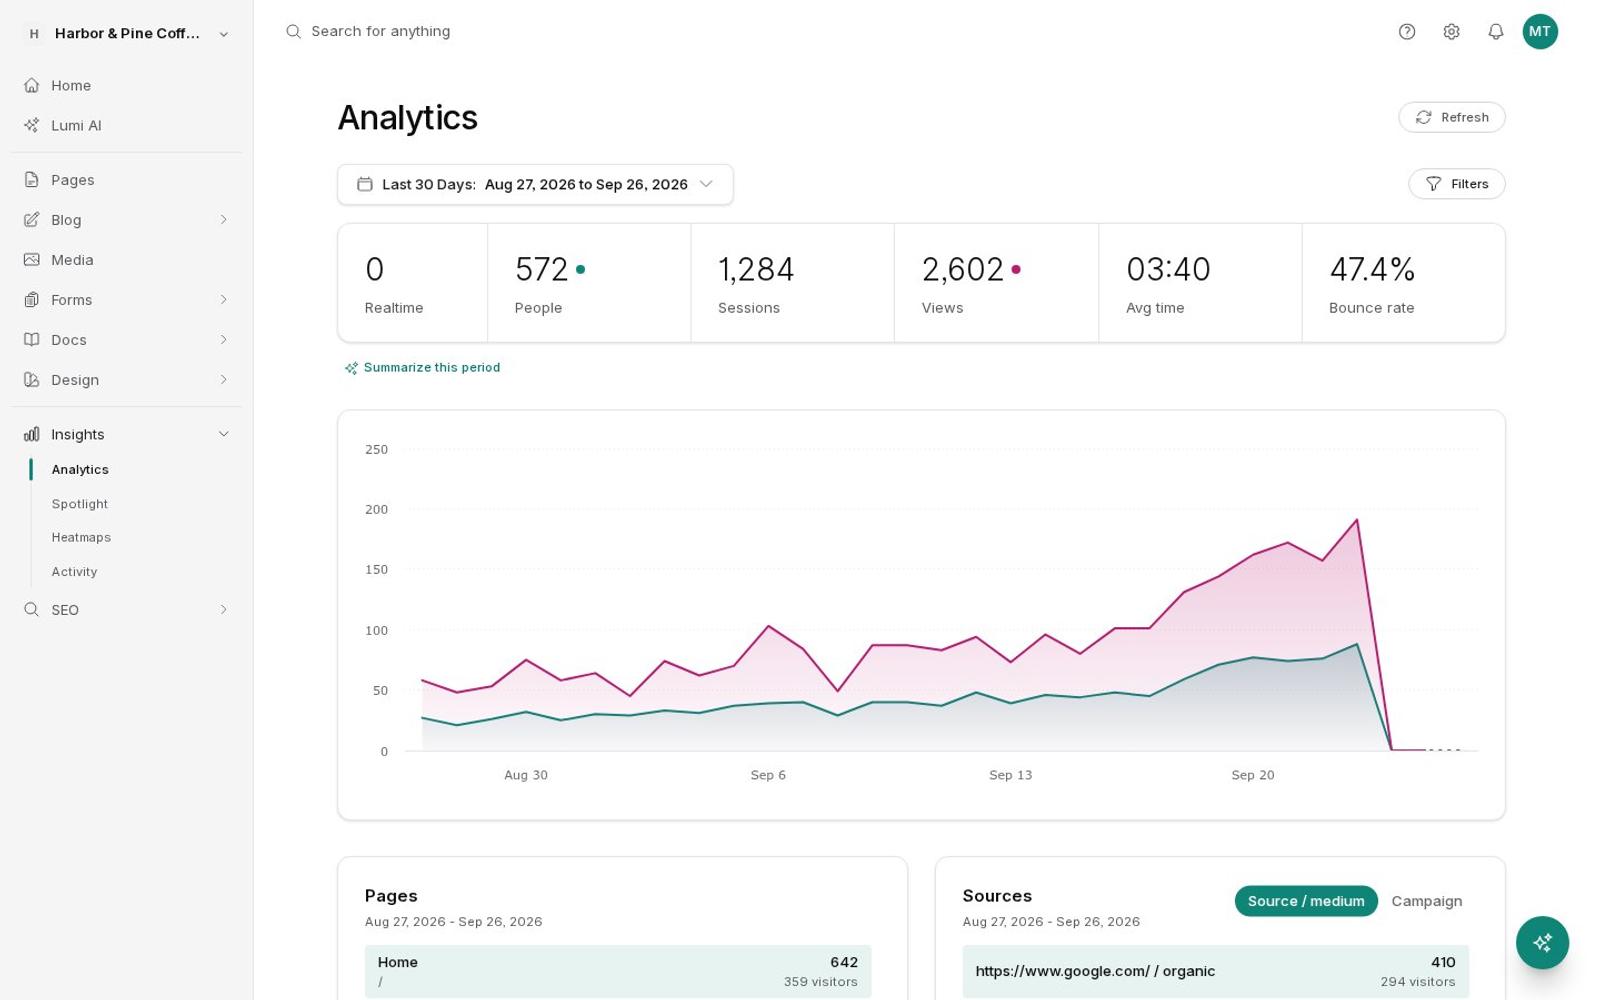
Analytics with people, sessions, views, and a 30-day chart
Prompt

Summarize how my website is performing: traffic, top pages, and anything I should act on.

Query analyticslast 30 days
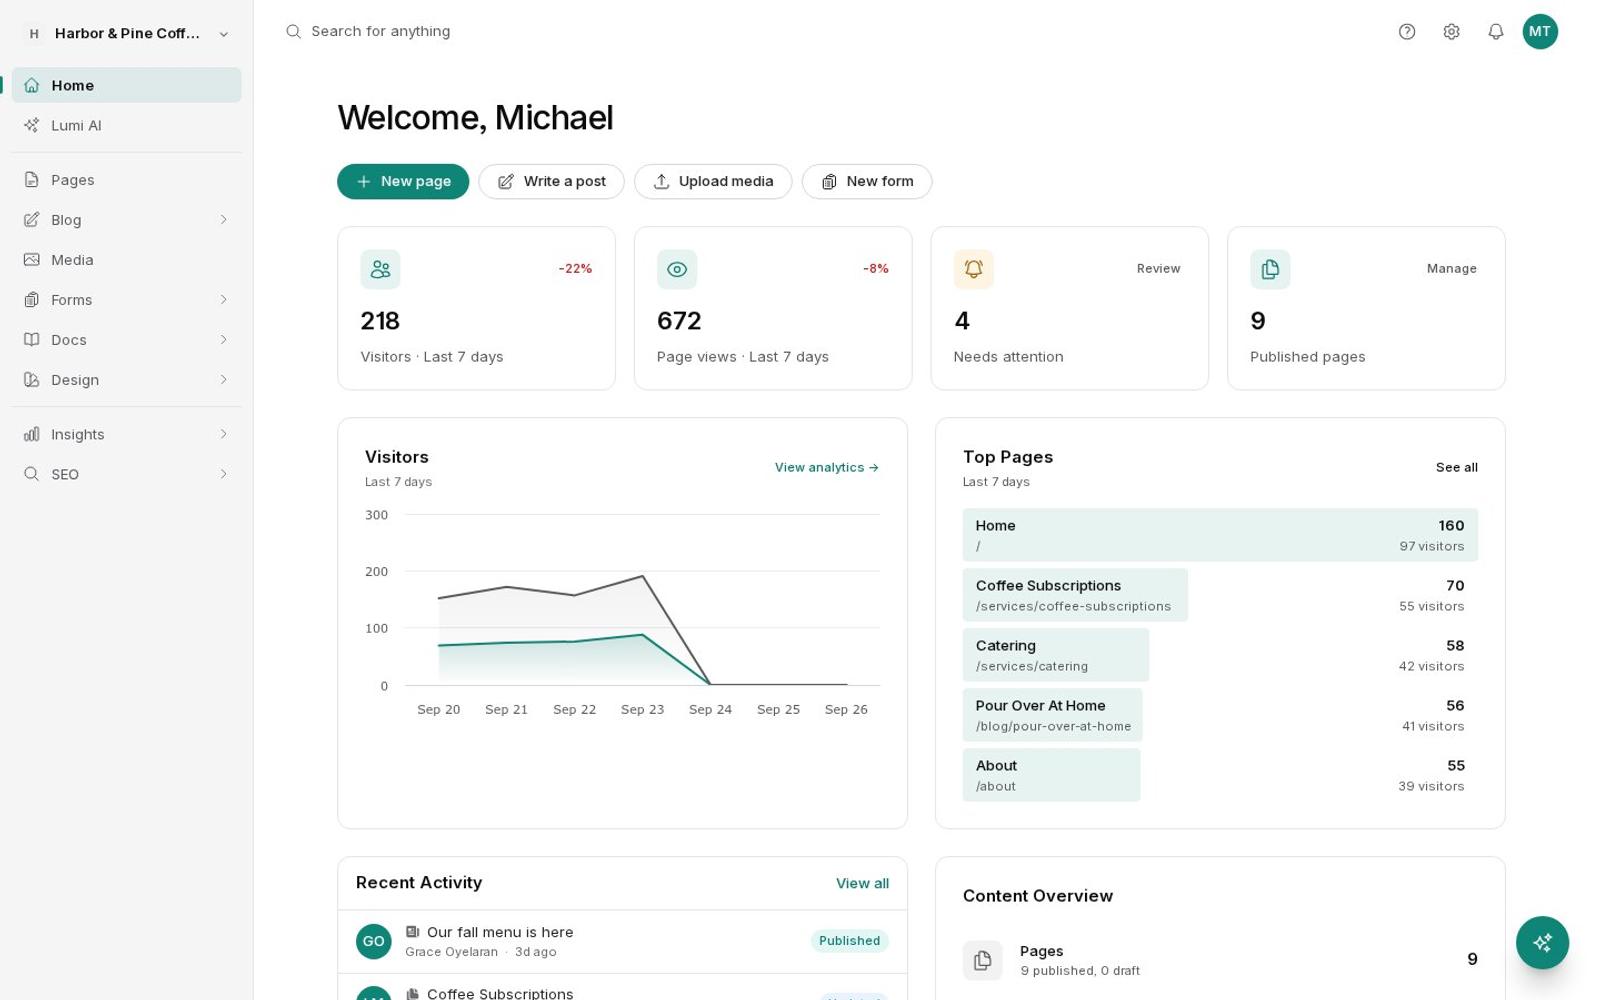
2,602 views from 572 people. Google organic is the top source, and Coffee Subscriptions is the second most visited page. Want me to add a subscription button to the homepage hero?
Find the page people leave

Sort pages by bounce rate, open the heatmap for the worst one, and replay a few sessions that ended there.

Ask which pages lose people. The agent checks the numbers and suggests a fix you can approve.

Heatmaps list with a map for each page
Prompt

Which pages have the highest bounce rate this month, and what would you change on the worst one?

Query analyticspages, bounce
Get page/catering
Catering has the highest bounce rate at 71%. The quote form is below three long paragraphs. Want me to move it up and draft a shorter intro?

See which posts bring visits

Switch Sources between source and campaign. Links tagged with UTM parameters show up by name.

Ask where visitors came from. The agent compares sources and campaigns for any range you name.

Dashboard with visitors, top pages, and sources
Prompt

Compare visits from Instagram and Google this month. Which one sent people who stayed longer?

Query analyticssources
Google sent 294 visitors and Instagram sent 118. Instagram visits were shorter but more of them reached the menu. Your fall latte post did best.

First-party by design. Private by default.

  • No third-party scriptTracking runs on the same servers as your site, so there is nothing to paste in and no outside tracker on your pages.
  • No raw IP addresses storedAnalytics counts visitors with a one-way hash, so the stored numbers never hold anyone's IP address.
  • Typed details stay hiddenSpotlight blanks passwords, emails, phone numbers, and card fields, and masks other typed text by default.
  • Recordings expireSession recordings are kept for 30 days by default.
Also in Insights

Everything else you'd want to know.

3on site now
  • /2
  • /menu1
MJR

On site now

See how many people are browsing right now and which pages they're on.

google / organic410
instagram / social232
fall-menu / email151
direct92

Sources and campaigns

Referrers, search, and social, plus links tagged with UTM parameters by campaign name.

  • Mobile62%
  • Desktop33%
  • Tablet5%

Countries, devices, browsers

Know where visitors are and what they browse on before you design for them.

Portland, ME4 pages
Boston, MA2 pages
Montreal, QC6 pages
Falmouth, ME1 page

Visitor list

Filter individual visitors and open the sessions they recorded.

203.0.113.42Excluded
575572people this month

Leave yourself out

Exclude your own IP address, or your office's, so your visits don't count.

404/fall-menu-2025
301/menu

Broken links

Pages that returned 404 show up in analytics, so you can redirect them.

Order ahead
Rage click ×4

Rage clicks

Heatmaps count repeated frustrated clicks, a quick sign that something looks clickable and isn't.

Session summary

Session summaries

One click turns a recorded visit into a short note: where they came from, what they read, and where they left.

Questions

About Insights.

Do I need to install anything?

No. Analytics, Spotlight, and heatmaps run on every BrightSite site with nothing to add or configure.

Does Spotlight record what people type?

Passwords, emails, phone numbers, and card fields are blanked, and other typed text is masked by default. The page itself is recorded so you can see what the visitor saw.

How long are recordings kept?

30 days by default.

Can Lumi answer questions about my traffic?

Yes. Lumi and connected agents like Claude and ChatGPT can query your analytics, including visitors, pages, and sources. Replays and heatmaps are for you to watch in the app.

Can I keep my own visits out of the numbers?

Yes. Exclude your IP address, or your whole office's, in the analytics settings.

Stop guessing
what visitors do.

7 days free. No credit card.Start free trial →